


















Bioelectrical impedance vector analysis (BIVA)

BIVA: body composition analysis for people with fluid and electrolyte imbalance.
Analysers using bioelectrical impedance vector analysis, BIVA, are intended for patients with fluid and electrolyte imbalance.
Traditional BIA measurement bases its calculations on the assumption of a standard proportion of water in the patient's body.
In patients with abnormal body water, that is an abnormal ratio of total body water to extracellular water (TBW/ECW), which is common, for example, in nephrology patients, measurement errors in prediction equations are much more common.
Because BIVA uses direct measurements of reactance (Xc) and resistance (R) to assess hydration and cellular status, physicians can carry out initial screening and track changes in body water, even in dialysis patients.
BIVA also provides information on nutritional status and other valuable information about patients' weight in diabetology, oncology and psychology (treatment of anorexia and bulimia). Remember that malnutrition is possible even in obese people, but it may be hard to detect with traditional body composition results.
In general practice, BIVA makes diagnosis easier and allows preliminary conclusions that can be verified with further diagnostic tests.
BIVA compares the measured resistance (R) and reactance (Xc) of the examined person with healthy people of the same sex, age and ethnic origin. This makes it possible to track changes in cellular status and determine whether the results deviate from the norm.
Chart description:
The three ellipses correspond to the results of the reference group shown on the body composition chart (often called BCC). 95% of the population falls within the outer ellipse, 75% within the second and 50% within the innermost one. In other words, the further the measurement point lies from the centre, the more the results deviate from the norm.
Piccoli et al. A new method for monitoring body fluid variation by bioimpedance analysis: the RXc graph. Kidney Int 1994; 46(2): 534-539.
Photo gallery


Charder Charder: Featured brand Software for Scales and Body Composition Analysers
Charder Insight - Body Composition Analyser Software
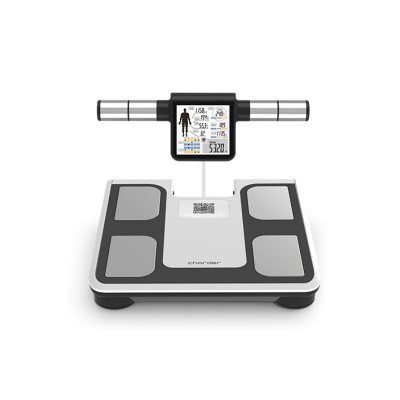
Software for the Charder MA601, MA801 body composition analysers. The program lets you control the analyser from a computer. The basic version of the software is free.
Software for the Charder MA601, MA801 body composition analysers. The program lets you control the analyser from a computer. The basic version of the software is free.
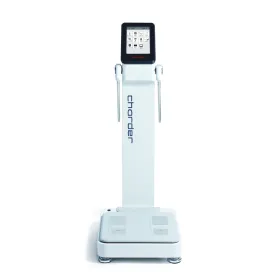


Charder Charder: Featured brand Medical Body Composition Analysers
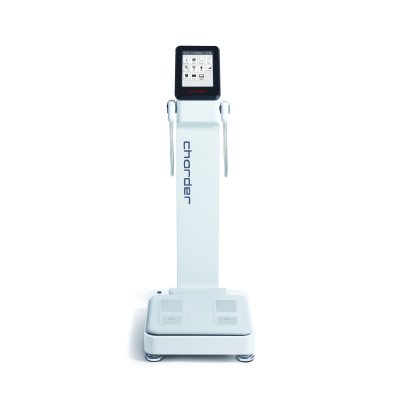
Charder MA801 Medical Body Composition Analyser
Code: MA801
HIGH END analyser. Uses BIVA technology for patients with disturbed water balance. Applications: paediatrics - patients from 6 years, obesity, nephrology, geriatrics, sports medicine, aesthetic…
HIGH END analyser. Uses BIVA technology for patients with disturbed water balance. Applications: paediatrics - patients from 6 years, obesity, nephrology, geriatrics, sports medicine, aesthetic medicine, dietetics.
Leave a comment